Appearance
What do I see in the dashboard?
The dashboard gives you full visibility and control over all your connected Facebook, Instagram, and TikTok assets, including Profiles, Business Managers (BMs), Pages, and linked accounts.
Main view: Business Managers & Pages
The default view shows your connected assets in a table with key metrics per row: Comments, Processed, Moderated, Engaged, moderation and engagement percentages, and Cost.
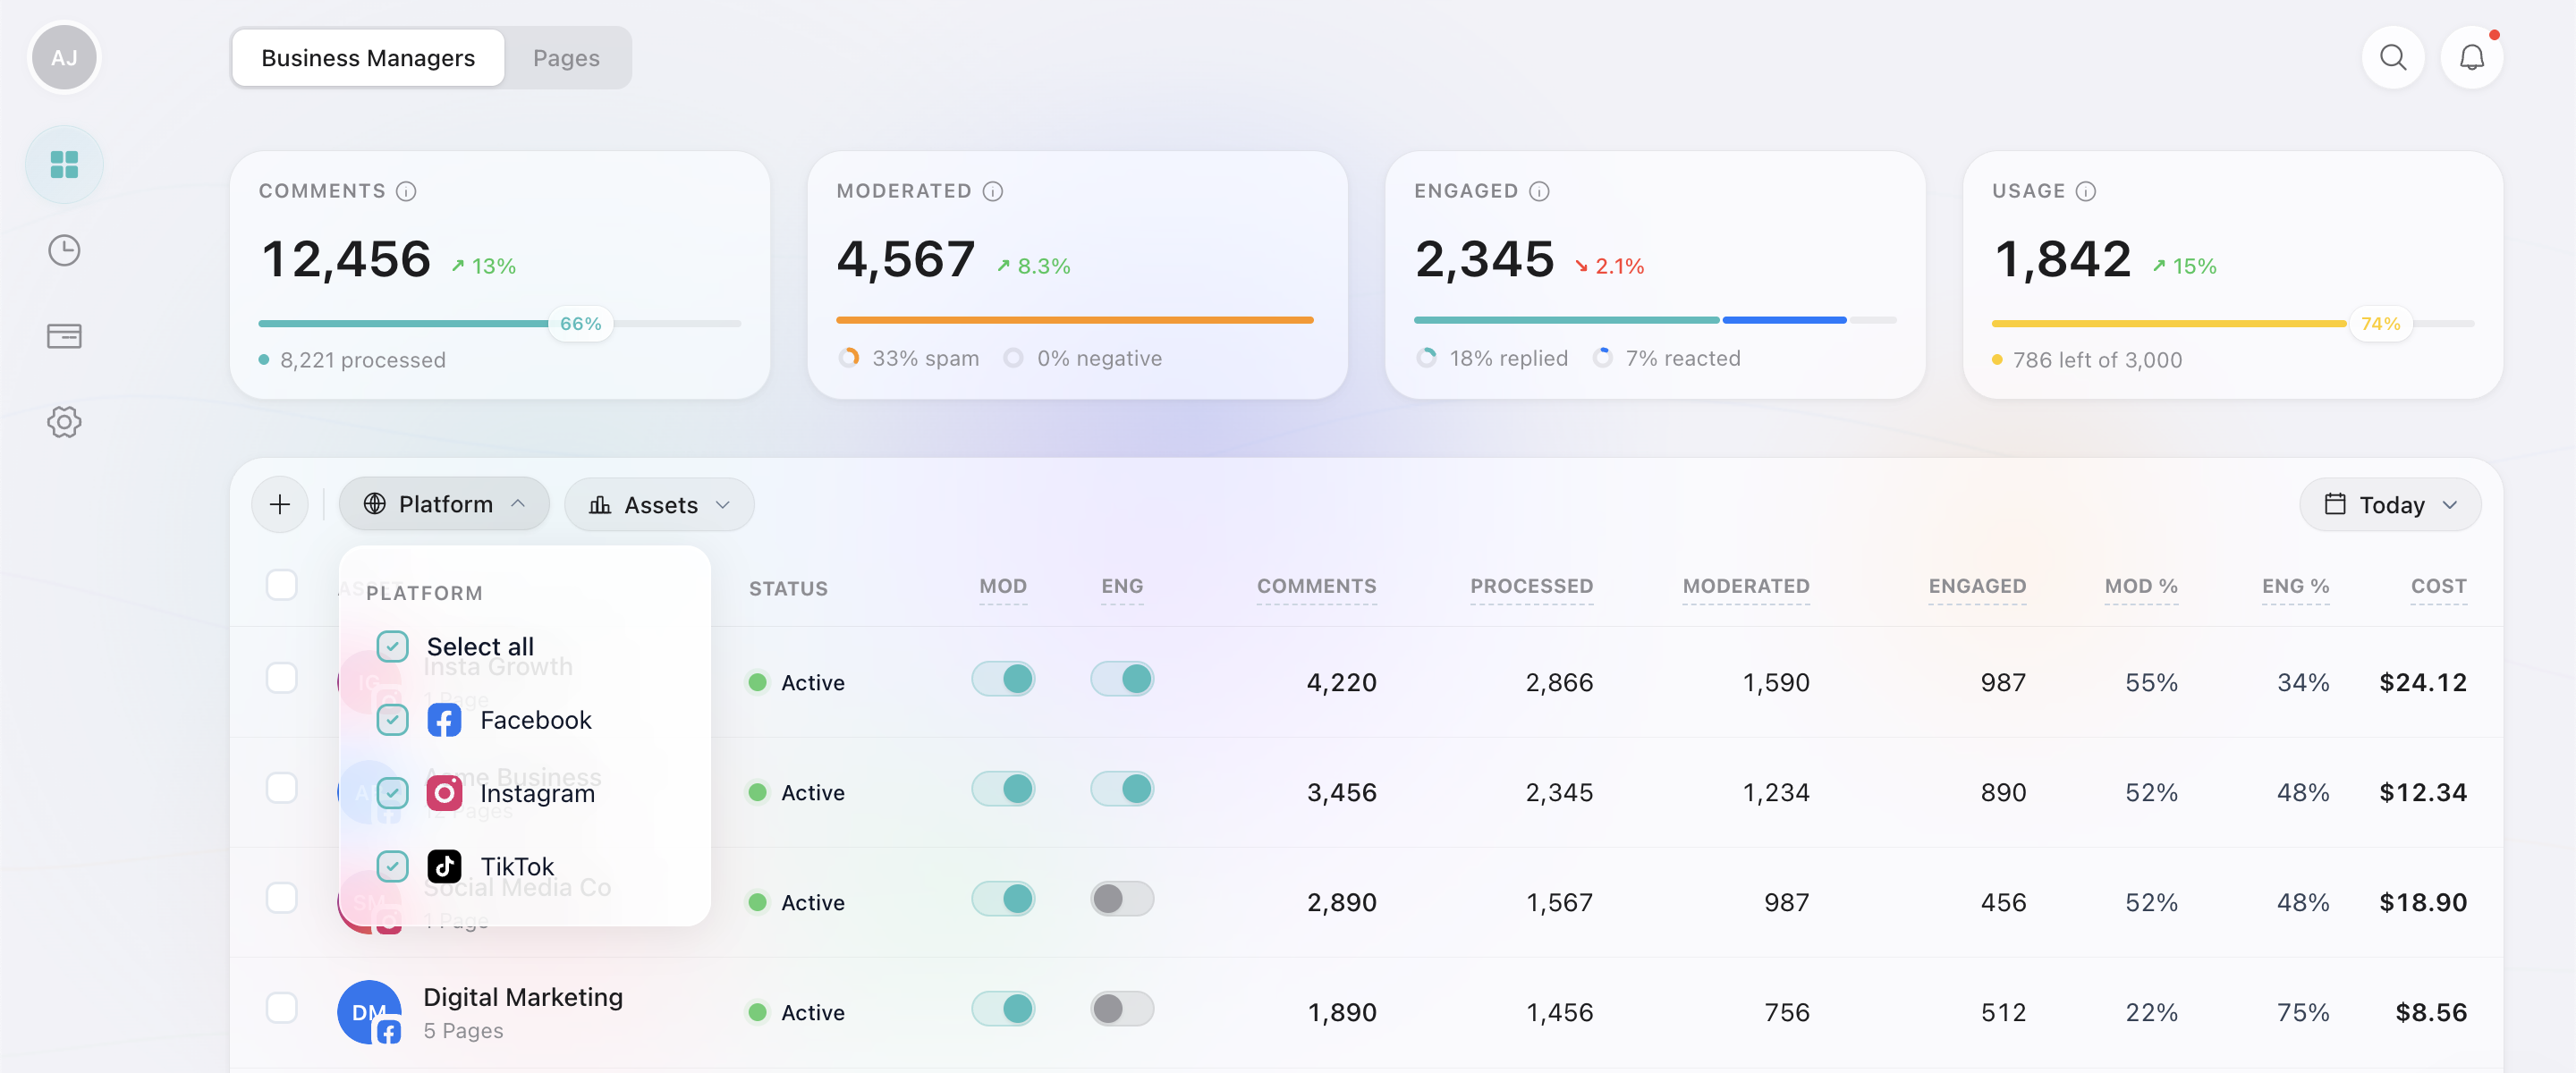
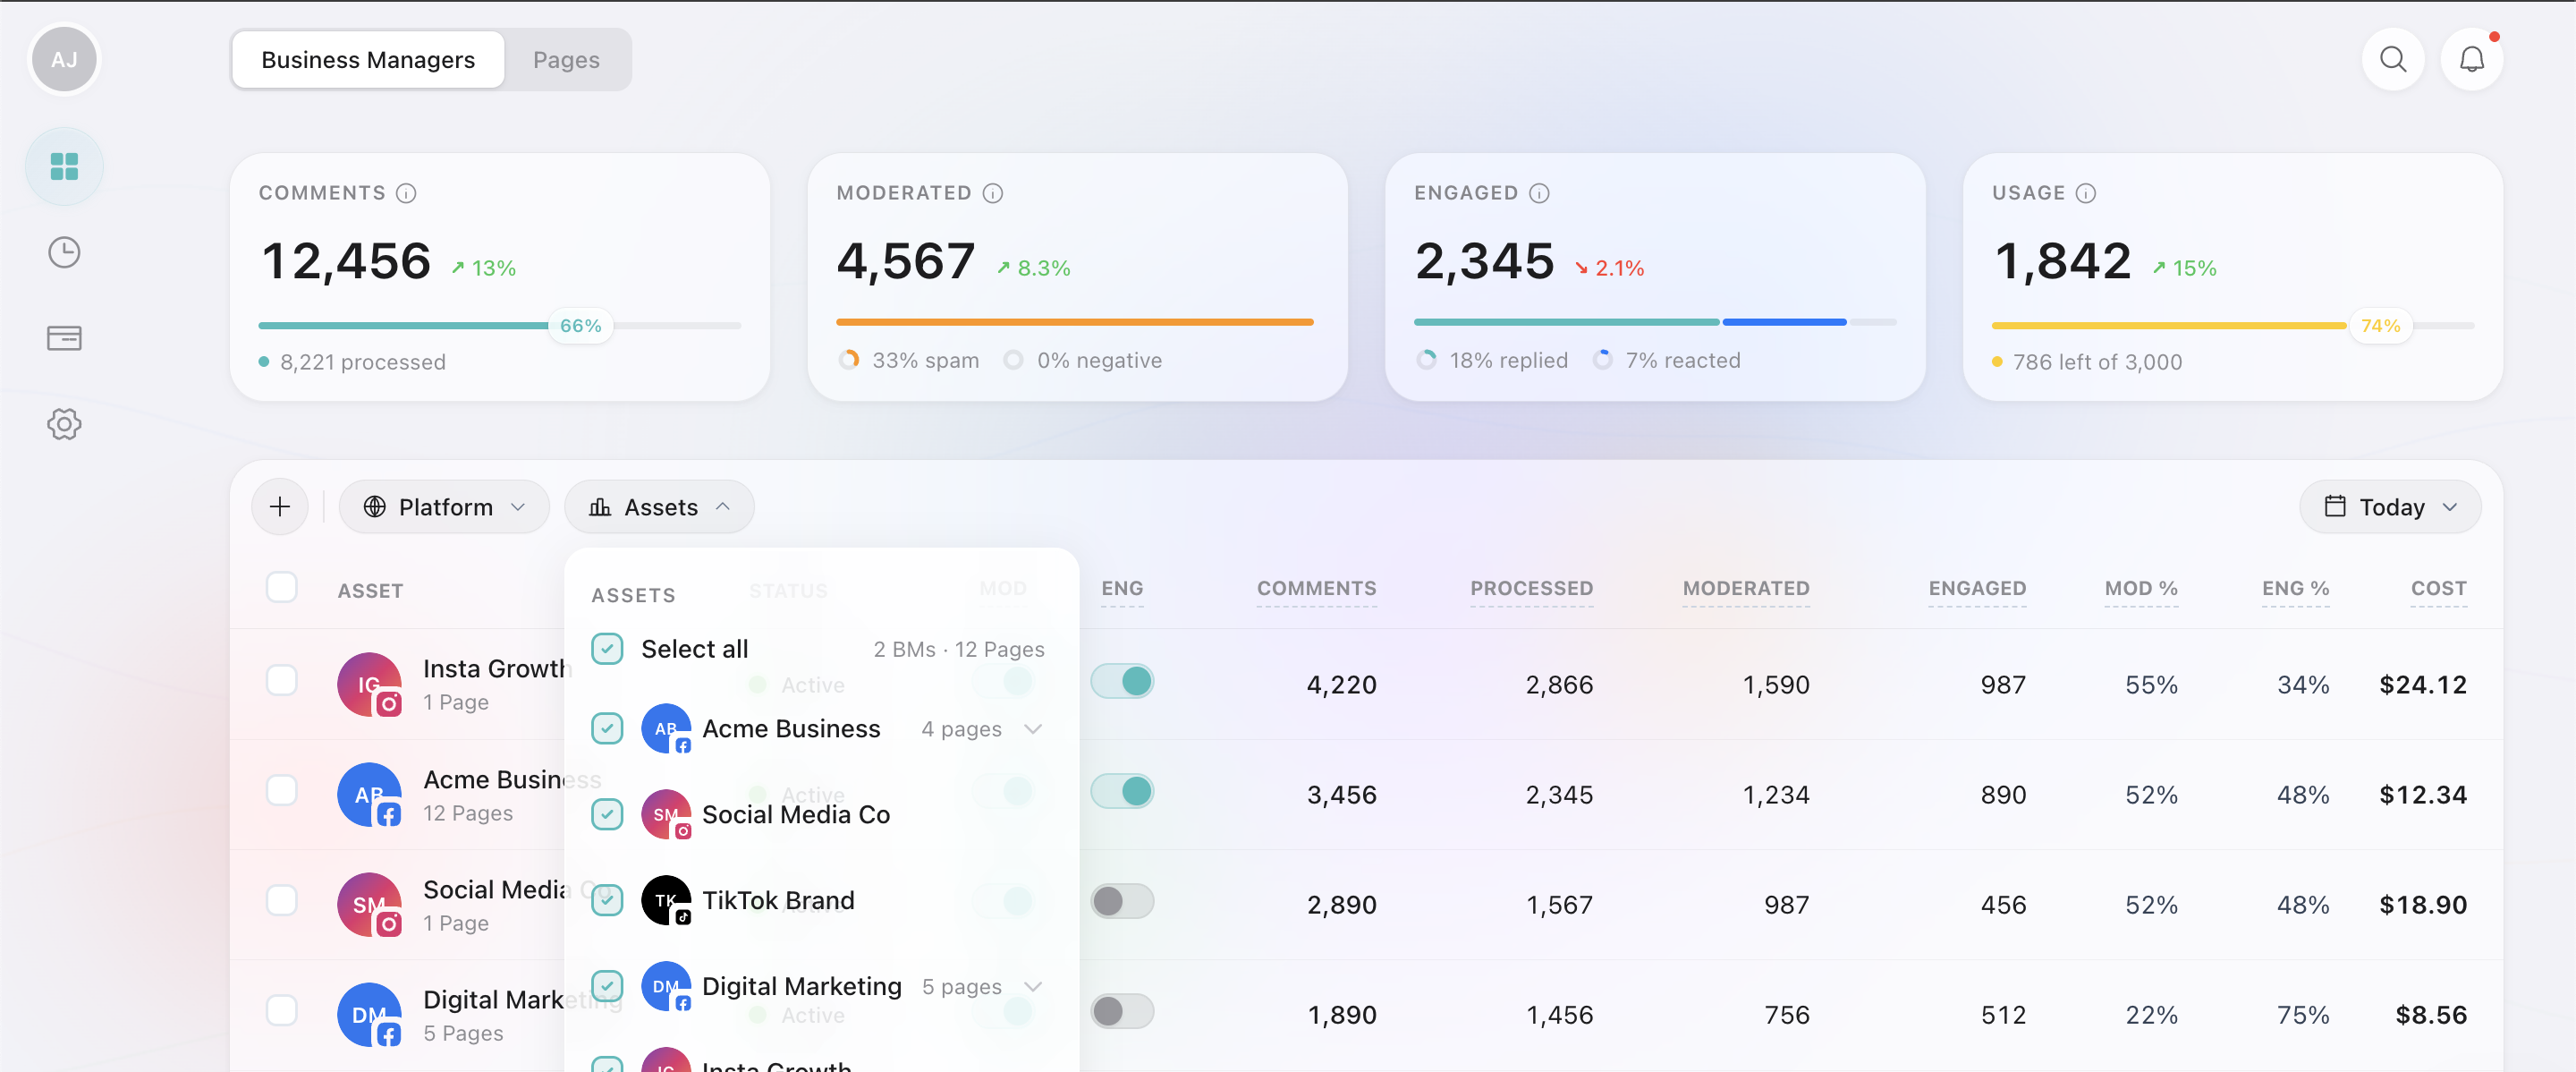
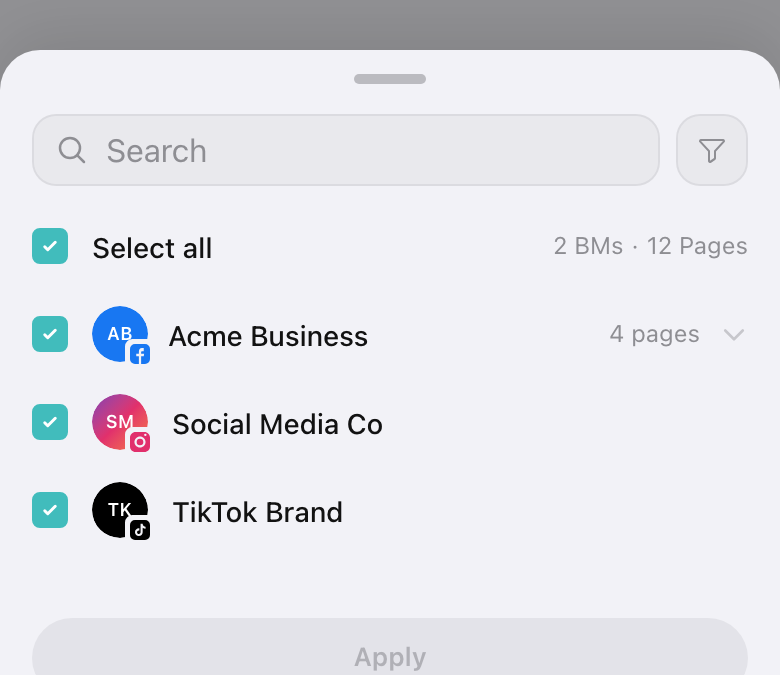
Use the Platform and Assets dropdowns to filter by network or specific BMs and Pages.
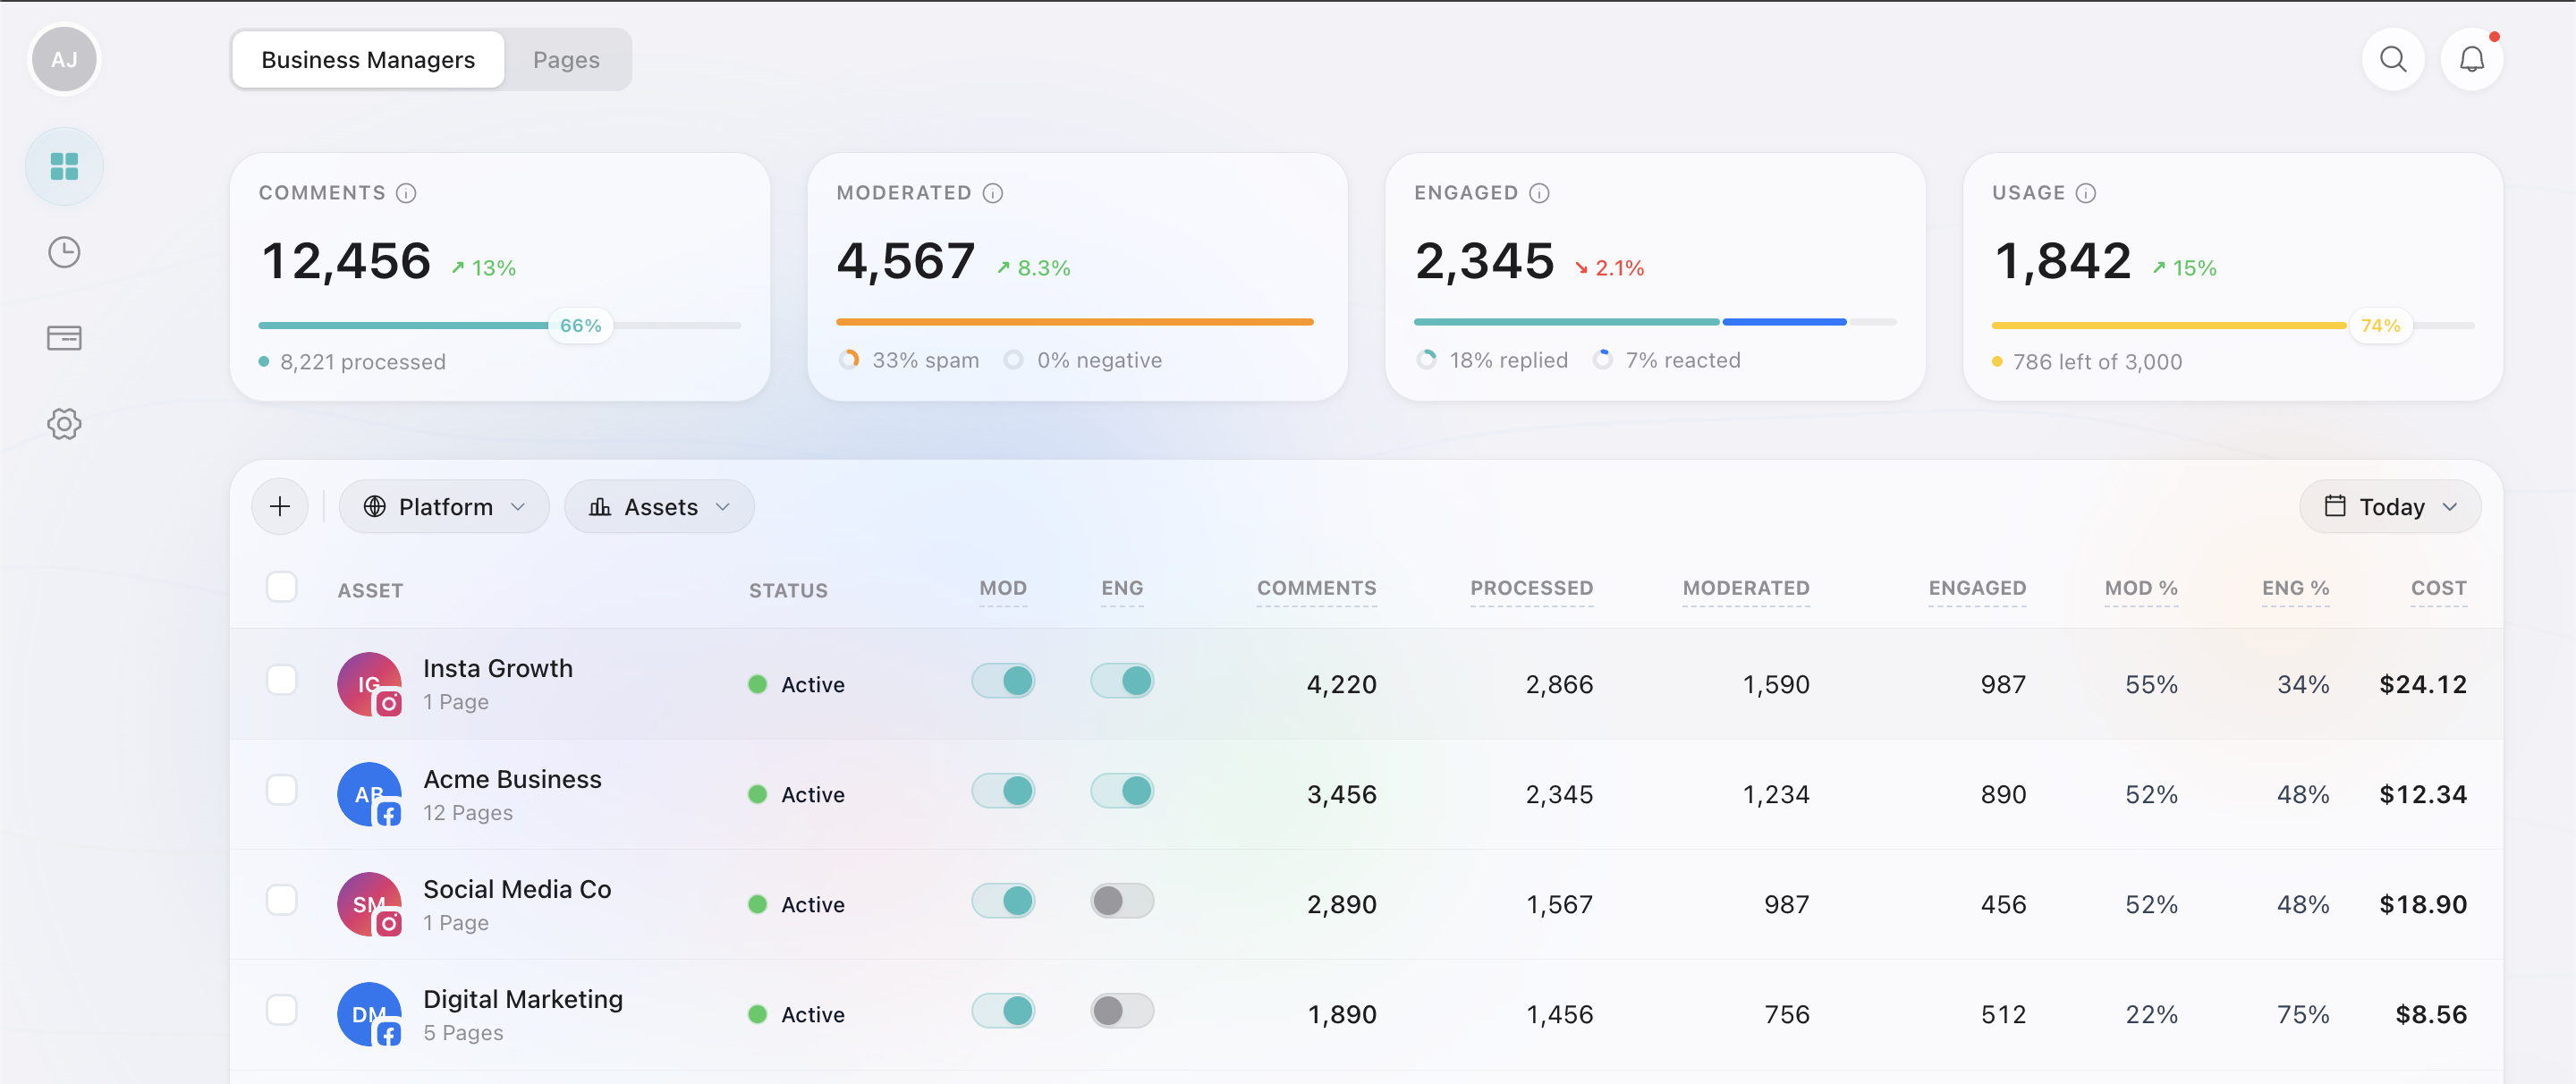
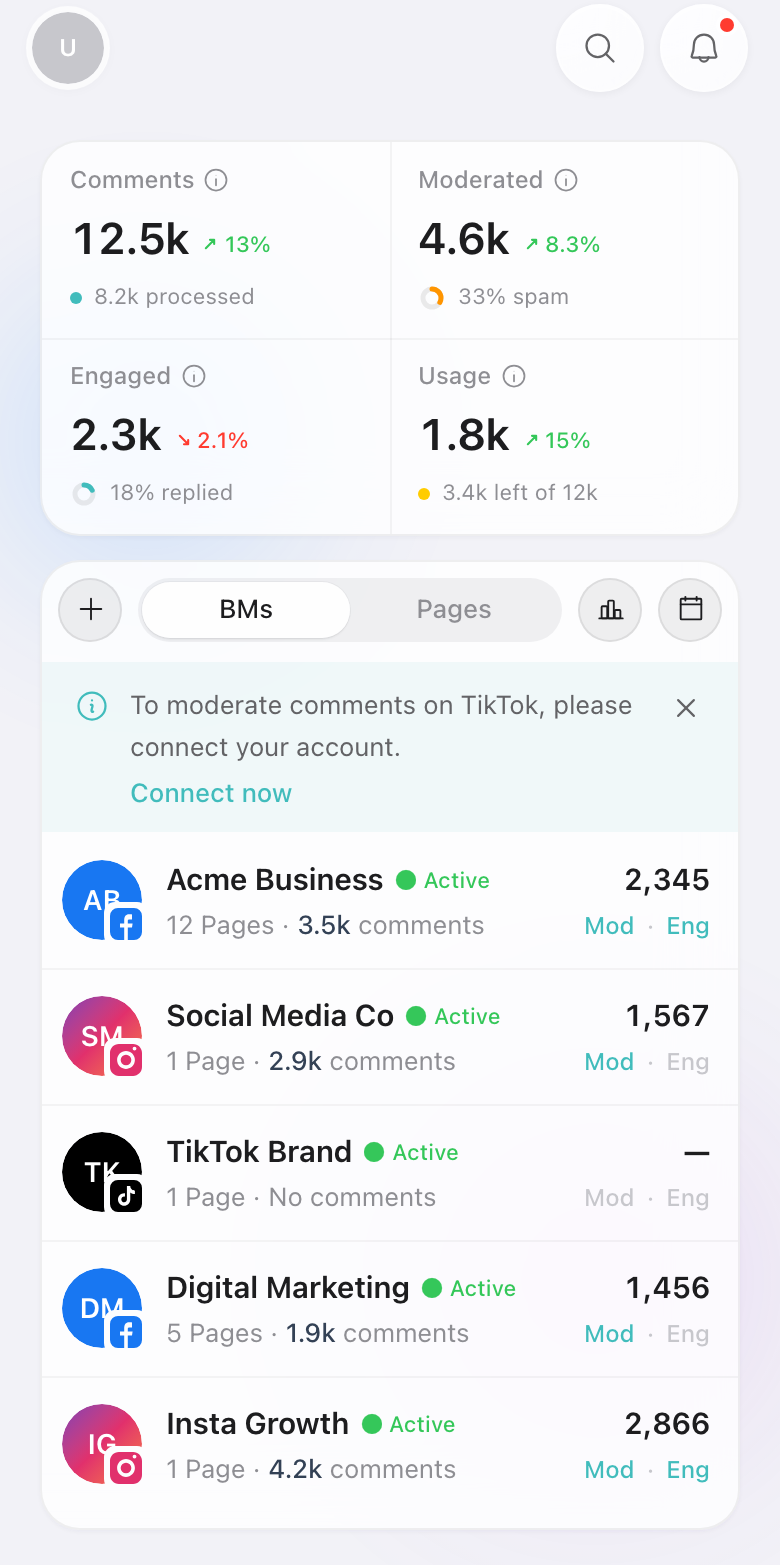
At the top, four stat cards give you a quick summary:
Comments
Total comments received, with processing progress.
Moderated
Comments classified: spam % and negative %.
Engaged
Comments we replied to, reacted to (a Like or Love), or intentionally ignored.
Usage
Comments counted against your plan's monthly limit.
Comments view: every comment and action
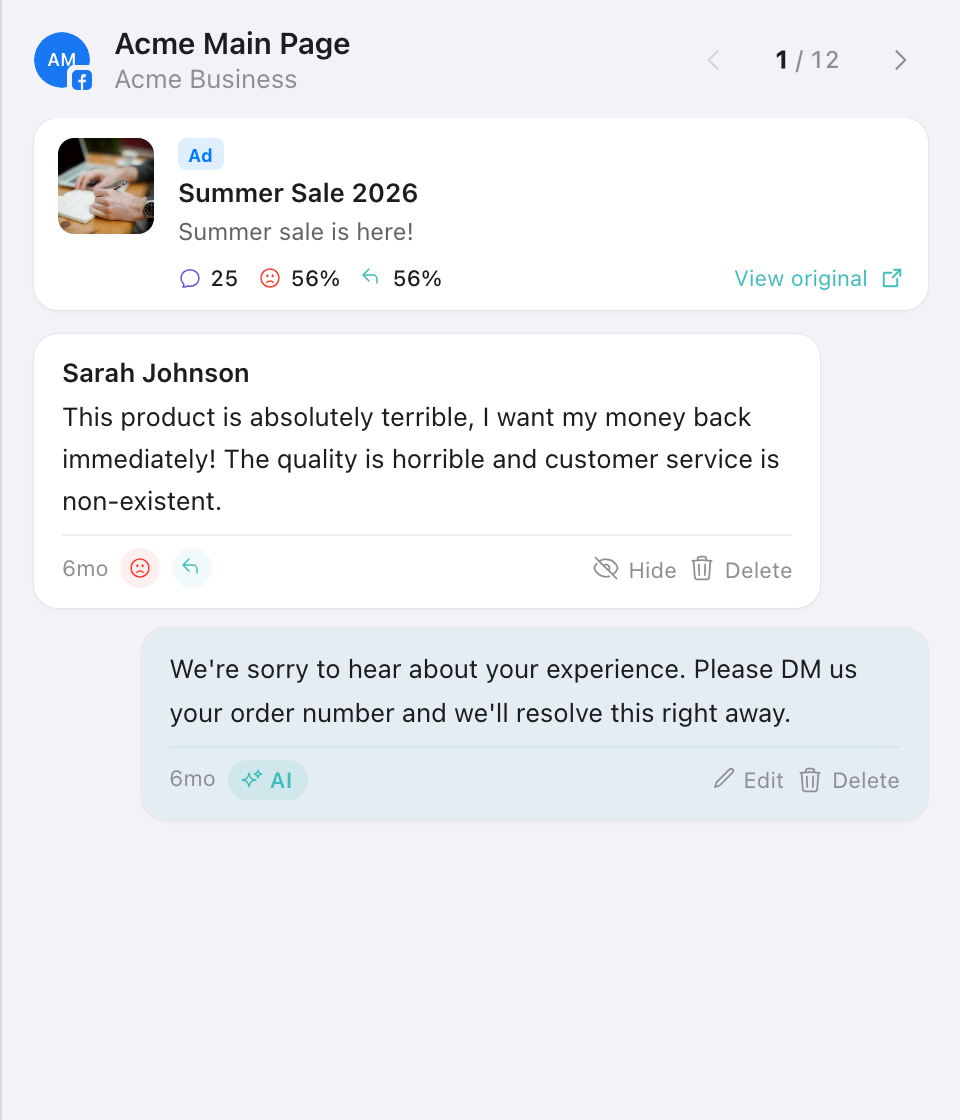
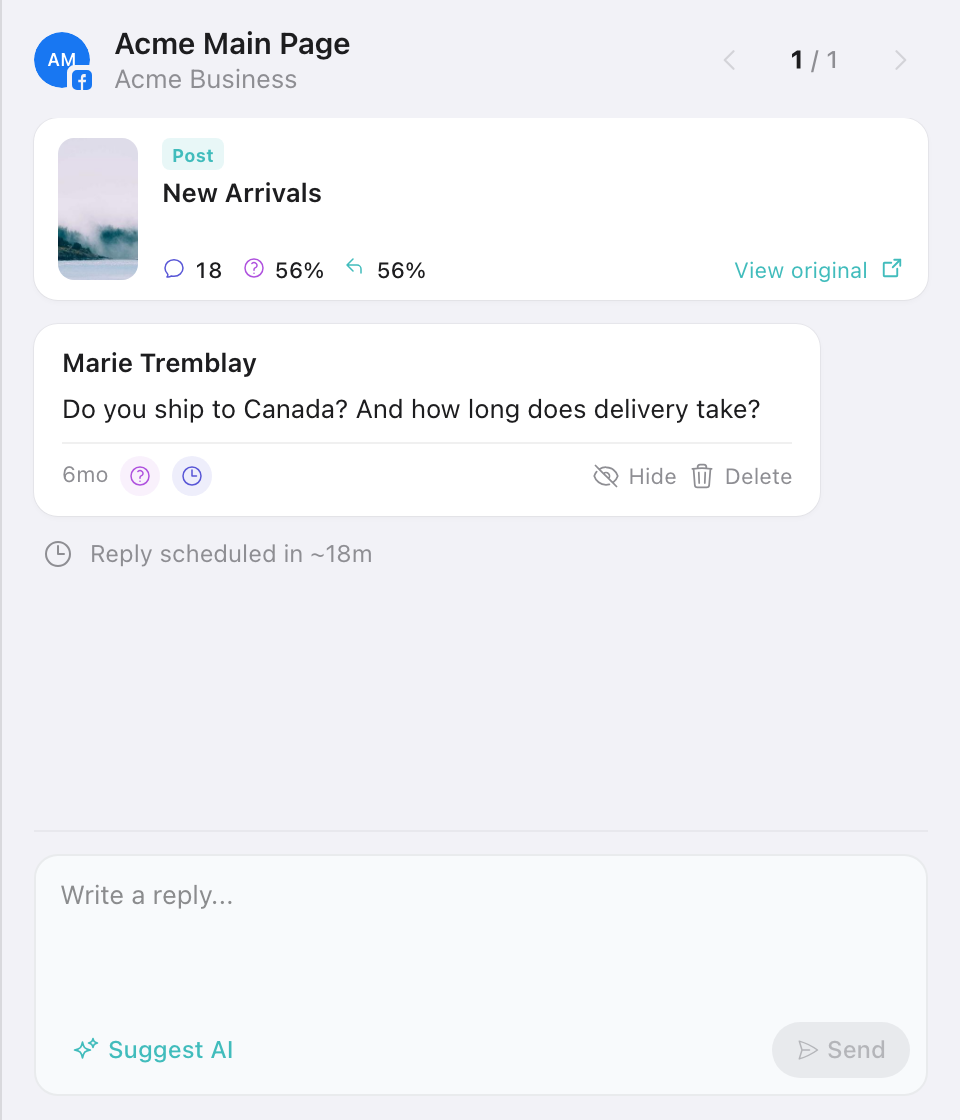
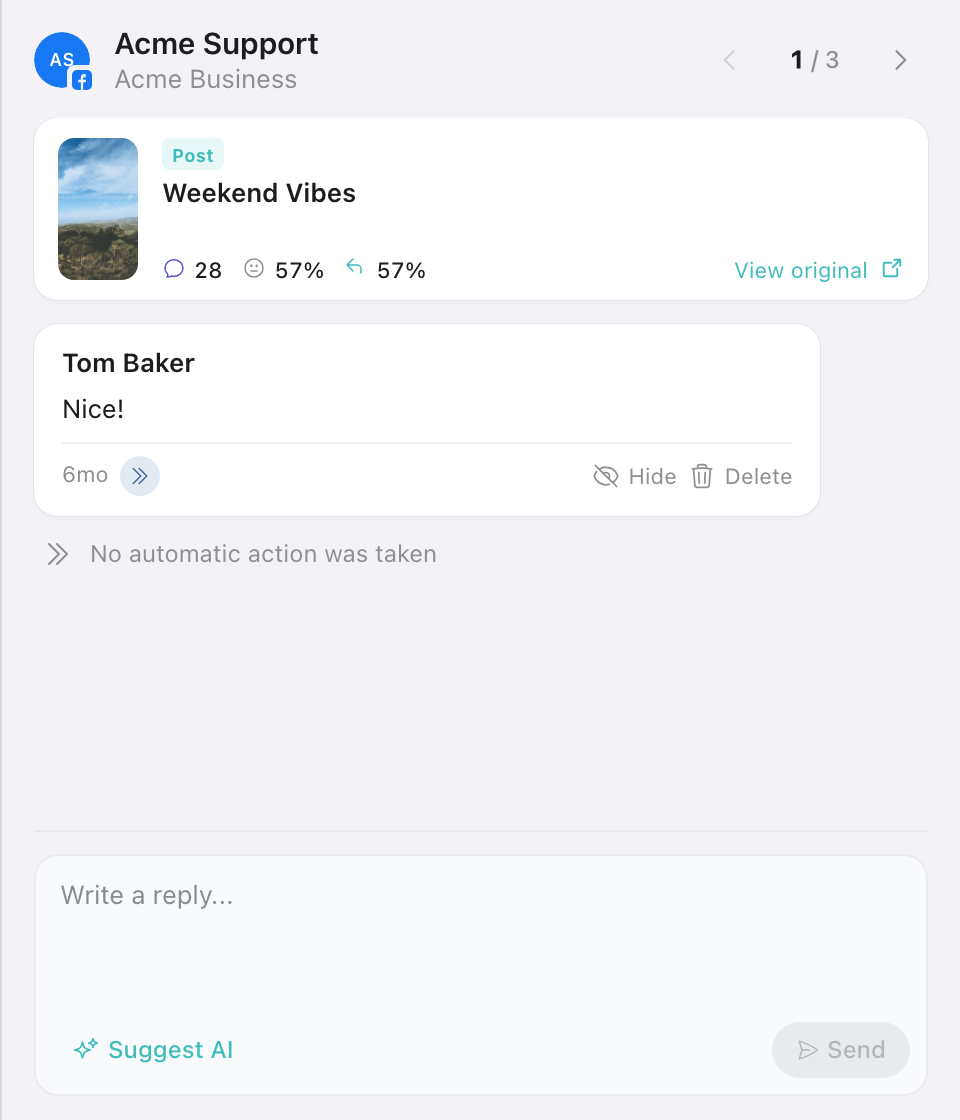
Switch to the Comments tab to see individual comments with their category (Positive, Neutral, Question, Negative, Spam) and the action Reply200 took (Replied, Reacted, Hidden, Ignored, Deleted).
Filter by Platform, Assets, and Tags, or use the date picker to narrow the timeframe.

The Comments view also shows Sentiment, Actions, and Peak Hours cards at the top, so you can spot trends at a glance.
Click any comment to open its detail panel: the original post or ad it came from, the comment, and the reply we sent, with quick actions to edit, hide, or delete. Use the arrows to step through comments one by one. What the panel shows depends on which bucket the comment is in: Processed carries the reply, Pending shows when it goes out, and Skipped says why nothing was sent.
Everything is grouped and filterable, so you can manage multiple brands or clients from a single view. Your entire operation, at a glance.